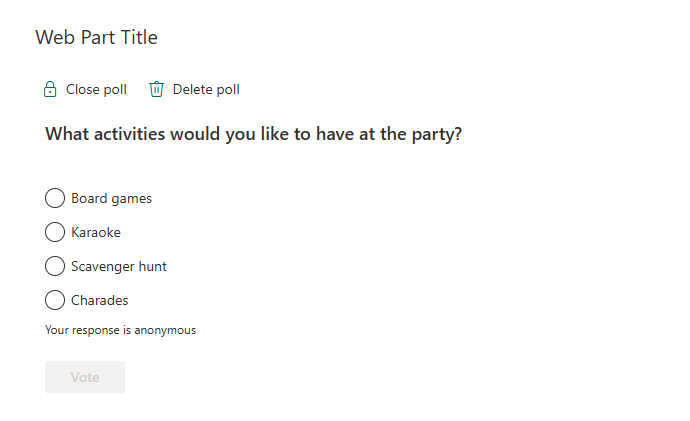
How to Add and Configure the Vitextra Quick Poll Web Part
Overview
This article explains how to place the Vitextra Quick Poll web part on a SharePoint Online page, create a poll, and tune the web part through its property pane. It assumes the Quick Poll package has already been deployed to your tenant App Catalog.
💡 Tip
If Quick Poll is not yet available on your sites, deploy it first — see the KB10035. Installing Cloud-based Product article.
Before you begin
- Quick Poll must be added to the tenant App Catalog and enabled for your site.
- You need permission to edit the page (Member access or higher on the site).
- No additional API permissions are required — the web part works entirely within your SharePoint site.
Step 1. Add the web part to a page
- Open the SharePoint page where you want the poll and switch it to edit mode with Edit in the top-right corner.
- Move the mouse over the area where the poll should appear and click the circled + (Add a new web part).
- In the toolbox, type Quick Poll in the search box and select the web part from the results.
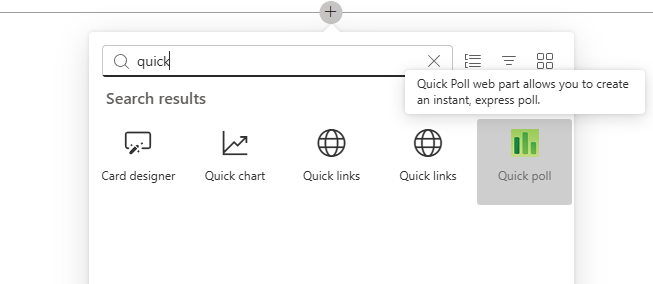
The web part is inserted into the section and immediately shows the poll creation form.
📝 Note
The first time Quick Poll is added to a site, it automatically creates two SharePoint lists — Vitextra Quick Poll Questions and Vitextra Quick Poll Responses — to store poll data. You do not need to create them manually.
Step 2. Create the poll
In the creation form, choose Create Poll to build a new poll (or Select Existing to reuse a poll already created on this site). Enter the Question, an optional Description, add your answer options with the Add option button, and click Save.
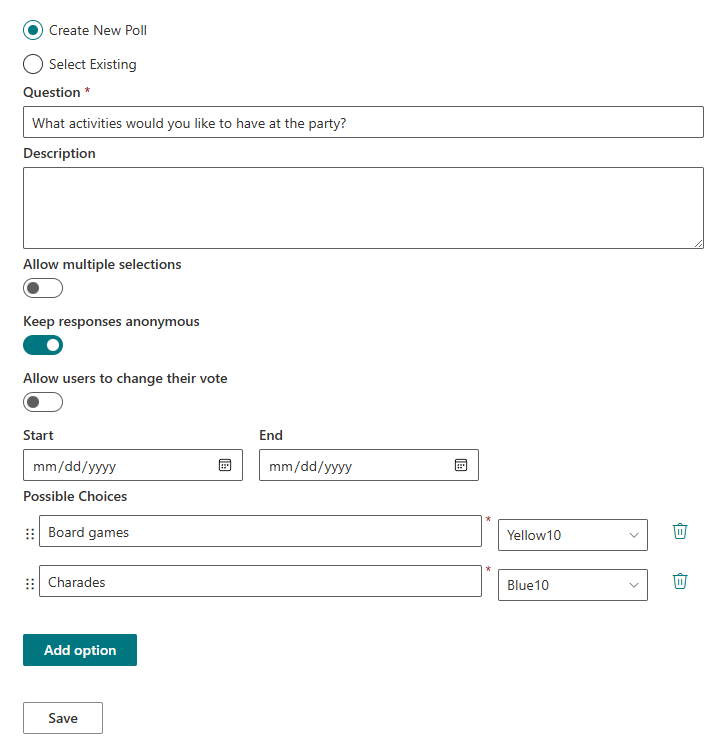
For a full description of every field and option — multiple selection, anonymous responses, colors, scheduling — see the KB10215. Quick Poll. Solution Overview article.
Step 3. Configure the web part
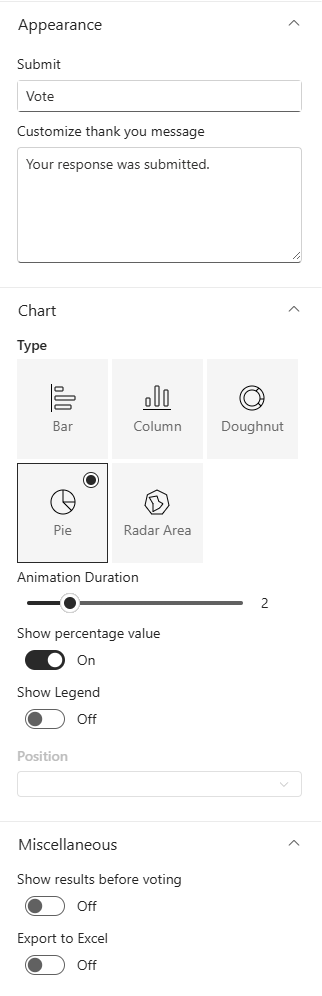
With the page still in edit mode, select the web part and click the pencil (Edit web part) icon on its left toolbar to open the property pane. The settings are organized into accordion groups.
Appearance
| Setting | Description |
|---|---|
| Vote button text | The caption of the vote button shown to participants (default: Vote). |
| Customize thank you message | The message shown to a participant right after they submit a response. |
Chart
| Setting | Description |
|---|---|
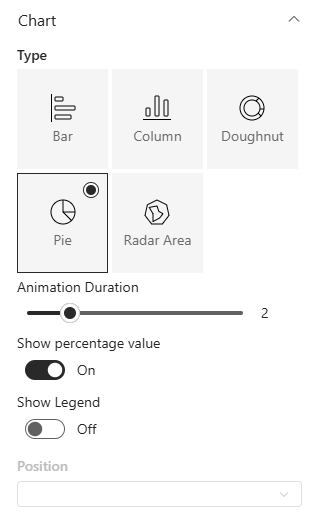
| Type | The results chart type: Bar, Column, Doughnut, Pie or Radar Area. |
| Animation Duration | How long the chart animates on appearance, from 0 to 10 (0 disables the animation). |
| Show percentage value | Displays each option's vote share as a percentage directly on the chart. |
| Show Legend | Shows a legend (available for Pie and Doughnut charts). |
| Position | Legend position — Top, Right, Bottom or Left (enabled only when the legend is shown). |
Miscellaneous
| Setting | Description |
|---|---|
| Show results before voting | Lets visitors open the current results with a View Results button without casting a vote. |
| Export to Excel | Adds an export button under the results chart to download the results as an Excel workbook. |
Data Source
This group is informational. It contains links to the Questions and Responses lists, and, once a poll exists, the read-only Instance ID and Poll number that bind the web part to its data.
📝 Note
The Data Source fields are read-only and intended for diagnostics. The web part manages the connection to its lists automatically.
About
Shows license and version information for the product — subscription status, tenant and product version.
Step 4. Save and publish
Property-pane changes take effect immediately in edit mode. When you are happy with the result, click Republish (or Publish) to make the poll and its configuration live for visitors.